10.18.19 quiz
- Describe the community succession from the coast to Waimea, uphill.
- Describe the 4 survivorship curves
- Compare parasitism with predation
- Compare mutualism with commensalism
Extra credit: which one is more gross: a lamprey or a remora?
----------------------------------------
10.22.19 quiz
- When your rabbit population peaked, what was the rabbit and lynx population?
- When the lynx population peaked, what was your rabbit and lynx population?
- How would the graphs look if the predator were cold blooded?
- How could this model be used to map the spread of a disease?
----------------------------------------
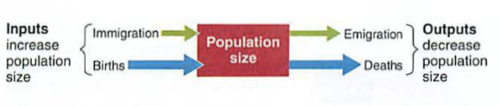
First of all a flow diagram:
 |
| Click for full-size image |
Note that this is for a country, not the planet, since people (so far) are not leaving the planet...or arriving from elsewhere.
National version as a formula:

If you look at the planet as a whole (sans aliens or Elon Musk):

so, there is a neat shorthand formula for this:

Which is an estimate, the real number is 69.3 (why? look below if you want to know)
Here is an example:

Note that as the growth rate increases, the doubling time decreases.
Look for this on the AP as multiples/fractions of 70: 14, 28, 35, and so on...
Now, to babies: TFR is the total number of babies a woman will have in her lifetime.
Replacement level fertility (RLF) is just above 2.0, (usually 2.1, as some babies don't reproduce or make it to reproductive age).
What does this mean in Japan, where young people are not having babies?
RLF depends on developed/developing nations as well (clean water, medical care, access to food, war)
Life expectancy: depends on these as well...
Infant mortality: under age 1 (reason for big Hawaiian one year birthdays)
child mortality: under 5
Look up life expectancy in 1900...
Look up the average family size and how many made it to age of 5 in 1900
What portion of the US population was farmers then?
Age structure diagrams/population pyramids-check these out: UAE, Japan, Sudan, Iraq/Iran, Russia----WHY?
See also baby boom and boom echoes...
Check this out:
---------------------------------------
10.25.19 quiz
- Give an example of how you might see the baby boom and boom echo on your population diagrams.
- You work for the UN tracking two nations: Kaimania and Ansonia. Kaimania has a growth rate of 14% and Ansonia has a growth rate of 3.5%. What are the doubling times for each?
- Kaimania has an immigration rate of 4%, a CDR of 2%, a CBR of 8% and an emigration rate of 2%. What is the growth rate for Kaimania?
- Why are first year birthdays such a big deal in some cultures?
-----------------------------------------
...and look these up:
- Go to 1950 and look at the US population. Look again in 1960. Where is the baby boom? Why were there so few babies born during 1940-45?
- If you were a 42 year old American in 2000, when were you born? How old are your kids? Find the "boom echo".
- Find the impact of the Iran/Iraq war of 1980-89, which side had the biggest impact? If you were a 35 year old Iraqi man in 1995, how old were you during this war?
- If you are a 30 year old German man in 1950, when were you born? How old were you in WWII (1936-1945)?
- If you were a 35 year old woman in Japan in 1960, why are there so few men to choose from?
- Look at the UK in 1960. Where are the casualties of WWII, and are they both male and female? Explain.
- What the heck is going on in UAE?
- Look at Russia in 1960. What gaps do you see? Why?
- Information about China is very spotty-why would this be? See if you can find the impact of the one-child policy from 1979-2016.
- Compare present day Japan to Africa. What issues will they need to address?
- Look at present day Italy, Japan and Germany. What is common?
- Compare present day India and China. What do you see?
Terms:
Fecundity: ability to reproduce
Fertility: production of offspring
CBR: crude birth rate: births per 1000 people
TFR: total fertility rate: total kids per woman in her lifetime (25-30!)
ZPG: zero population growth: 5+ where infant mortality is high, 2.1 is normal
China: was 6 -> 1.8 (below replacement level since 1979, one child policy)
140/100 male to female ratio: why?
Global TFR is 2.6
CDR: crude death rate: deaths per 1000
Why a life span? mitochondrial DNA...
1900 Indian man had life expectancy of 23!
Not now, reasons: nutrition CLEAN WATER, sanitation, education
75 men, 85 women (testosterone, war, "hold my beer and watch this!")
Dependency ratio; baby boomers and your future: how many workers to retirees
imagine your life at your age in other countries...
Russia low TFR: alcoholism and antibiotic resistant Tuberculosis
Module 23 Demographic Transition

Better diagram:
 Another possible version:
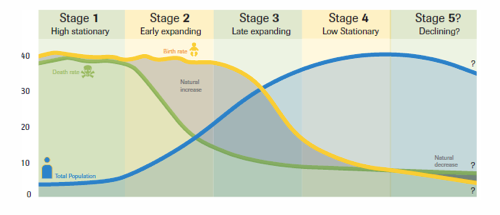 |
| Click for full-size image |
IPAT formula:

GDP vs. GNP (nationalism, global economy)
Urban areas, UGB (Portland)

See also Ecological Footprint Calculator:
Rule of 70, er 69.3...The TRUTH!
We know that Nt =Noe^rt
When Nt/No = 2, this is the doubling time
ln (Nt/No) = ln (e^rt)
ln(e^x) = x just like square root of x squared is x. They are reverse of each other...
ln (2) = 0.693 = rt
So...
0.693/r = t2, the "doubling time"
But wait! we saw 70, not .693...
Growth rates are in percent (part/100) so the percents cancel out, meaning you can just use percent as a number, like 14%.
You will certainly see this on an AP exam, usually as a multiple or fraction of 70: 14, 28, 35, 7, 3.5...
Rule of 70 rules! (or actually the rule of 69.3)....
See Predator Prey lab below for Population simulation worksheets
/groups/apenvironmentalscience/search/index.rss?tag=hotlist/groups/apenvironmentalscience/search/?tag=hotWhat’s HotHotListHot!?tag=hot6/groups/apenvironmentalscience/sidebar/HotListadminadmin2020-08-19 15:43:59+00:002020-08-19 15:43:59updated30adminadmin2011-09-08 21:36:21+00:002011-09-08 21:36:21updated29adminadmin2011-08-24 23:20:40+00:002011-08-24 23:20:40updated28adminadmin2011-08-24 22:42:36+00:002011-08-24 22:42:36updated27adminadmin2011-08-22 02:41:09+00:002011-08-22 02:41:09updated26adminadmin2011-08-22 02:40:02+00:002011-08-22 02:40:02updated25adminadmin2011-08-21 20:39:11+00:002011-08-21 20:39:11updated24adminadmin2011-08-21 20:30:42+00:002011-08-21 20:30:42updated23adminadmin2011-08-21 20:30:13+00:002011-08-21 20:30:13updated22adminadmin2011-08-21 20:25:48+00:002011-08-21 20:25:48updated21adminadmin2011-08-21 20:25:18+00:002011-08-21 20:25:18updated20adminadmin2011-08-21 00:22:12+00:002011-08-21 00:22:12updated19adminadmin2011-08-21 00:18:56+00:002011-08-21 00:18:56updated18adminadmin2011-08-21 00:15:43+00:002011-08-21 00:15:43updated17adminadmin2011-08-21 00:12:37+00:002011-08-21 00:12:37updated16adminadmin2011-08-21 00:12:02+00:002011-08-21 00:12:02updated15adminadmin2011-08-20 23:59:41+00:002011-08-20 23:59:41updated14Added tag - hotadminadmin2011-08-20 23:59:38+00:002011-08-20 23:59:38addTag13Added tag - conservationadminadmin2011-08-20 23:59:32+00:002011-08-20 23:59:32addTag12Added tag - critical thinkingadminadmin2011-08-20 23:59:19+00:002011-08-20 23:59:19addTag11Added tag - ch1adminadmin2011-08-20 23:59:08+00:002011-08-20 23:59:08addTag10Added tag - sustainabilityadminadmin2011-08-20 23:59:05+00:002011-08-20 23:59:05addTag9adminadmin2011-08-20 20:47:39+00:002011-08-20 20:47:39updated8adminadmin2011-08-20 20:46:15+00:002011-08-20 20:46:15updated7adminadmin2011-08-20 20:43:07+00:002011-08-20 20:43:07updated6adminadmin2011-08-20 19:14:13+00:002011-08-20 19:14:13updated5adminadmin2011-08-20 19:11:26+00:002011-08-20 19:11:26updated4adminadmin2011-08-20 18:59:57+00:002011-08-20 18:59:57updated3adminadmin2011-08-20 18:56:59+00:002011-08-20 18:56:59updated2First createdadminadmin2010-11-07 01:41:28+00:002010-11-07 01:41:28created1wiki2020-08-19T15:43:59+00:00groups/apenvironmentalscience/wiki/welcomeFalseCh01 Overview/groups/apenvironmentalscience/wiki/welcome/Ch01_Overview.htmladmin30 updatesCh01 Overview
Welcome to our APES wiki. You should be able to do the following after logging in with your account:
To create a new page, click the ...Falseadmin2020-08-19T15:43:59+00:00adminadmin2013-02-05 02:24:03+00:002013-02-05 02:24:03updated4Added tag - hotadminadmin2013-02-05 02:24:02+00:002013-02-05 02:24:02addTag3adminadmin2013-02-05 02:05:35+00:002013-02-05 02:05:35updated2First createdadminadmin2013-02-05 02:03:35+00:002013-02-05 02:03:35created1wiki2013-02-05T02:24:03+00:00groups/apenvironmentalscience/wiki/394a8FalseEnergy notes/groups/apenvironmentalscience/wiki/394a8/Energy_notes.htmladmin4 updatesEnergy notes
Week of 2.4.13: energy wrap-up
e2 video: coal vs. nuclear in class
AP exams: FRQ
2002.1
2004.2
2006.1
2007.2
2008.1
...Falseadmin2013-02-05T02:24:03+00:00adminadmin2013-02-05 02:23:20+00:002013-02-05 02:23:20updated6Added tag - hotadminadmin2013-02-05 02:23:18+00:002013-02-05 02:23:18addTag5adminadmin2013-02-05 02:23:12+00:002013-02-05 02:23:12updated4adminadmin2013-02-05 02:21:48+00:002013-02-05 02:21:48updated3adminadmin2013-02-05 02:20:26+00:002013-02-05 02:20:26updated2First createdadminadmin2013-02-05 02:06:00+00:002013-02-05 02:06:00created1wiki2013-02-05T02:23:20+00:00groups/apenvironmentalscience/wiki/c360bFalseFeb-May plan/groups/apenvironmentalscience/wiki/c360b/FebMay_plan.htmladmin6 updatesFeb-May plan
1. conclusion of energy chapters (see previous wiki)
2. GCC AP questions FRQ:
2006.2
2005.3
2005.4
2007.3
...Falseadmin2013-02-05T02:23:20+00:00adminadmin2012-03-07 05:53:55+00:002012-03-07 05:53:55updated14adminadmin2012-03-07 05:43:38+00:002012-03-07 05:43:38updated13adminadmin2012-03-07 05:41:35+00:002012-03-07 05:41:35updated12adminadmin2012-03-07 05:38:57+00:002012-03-07 05:38:57updated11Added tag - hotadminadmin2012-03-07 05:38:55+00:002012-03-07 05:38:55addTag10adminadmin2012-03-07 05:36:47+00:002012-03-07 05:36:47updated9adminadmin2012-03-07 05:22:26+00:002012-03-07 05:22:26updated8adminadmin2012-03-07 05:20:01+00:002012-03-07 05:20:01updated7adminadmin2012-03-07 05:18:58+00:002012-03-07 05:18:58updated6adminadmin2012-03-07 04:58:55+00:002012-03-07 04:58:55updated5adminadmin2012-03-07 04:57:33+00:002012-03-07 04:57:33updated4adminadmin2012-03-07 04:56:53+00:002012-03-07 04:56:53updated3adminadmin2012-03-07 04:54:20+00:002012-03-07 04:54:20updated2First createdadminadmin2012-03-07 04:53:33+00:002012-03-07 04:53:33created1weblog2012-03-07T05:53:55+00:00groups/apenvironmentalscience/weblog/de030FalseGreen Apple/groups/apenvironmentalscience/weblog/de030/Green_Apple.htmladmin14 updatesGreen Apple
Team,
Please watch this video about NYC:
Trailer:
http://www.pbs.org/e2/episodes/101_the_green_apple_trailer.html
On the server:
http://physics.hpa...Falseadmin2012-03-07T05:53:55+00:00adminadmin2011-09-13 19:08:24+00:002011-09-13 19:08:24updated4Added tag - hotadminadmin2011-09-13 19:08:22+00:002011-09-13 19:08:22addTag3adminadmin2011-09-13 19:08:10+00:002011-09-13 19:08:10updated2First createdadminadmin2011-09-13 19:04:30+00:002011-09-13 19:04:30created1weblog2011-09-13T19:08:24+00:00groups/apenvironmentalscience/weblog/4ecddFalseQuestions for Wednesday, wiki adds/groups/apenvironmentalscience/weblog/4ecdd/Questions_for_Wednesday_wiki_adds.htmladmin4 updatesQuestions for Wednesday, wiki adds
Team,
I'd like to try something for class tomorrow: each of you to create a question from chapter 3, and email it to me by this evening (Tuesday). Pl...Falseadmin2011-09-13T19:08:24+00:00hot/groups/apenvironmentalscience/search/index.rss?sort=modifiedDate&kind=all&sortDirection=reverse&excludePages=wiki/welcomelist/groups/apenvironmentalscience/search/?sort=modifiedDate&kind=all&sortDirection=reverse&excludePages=wiki/welcomeRecent ChangesRecentChangesListUpdates?sort=modifiedDate&kind=all&sortDirection=reverse&excludePages=wiki/welcome0/groups/apenvironmentalscience/sidebar/RecentChangesListmodifiedDateallRecent ChangesRecentChangesListUpdateswiki/welcomeNo recent changes.reverse5searchlist/groups/apenvironmentalscience/calendar/Upcoming EventsUpcomingEventsListEvents1Getting events…
Comments