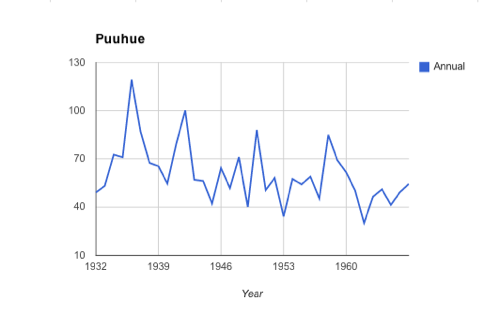
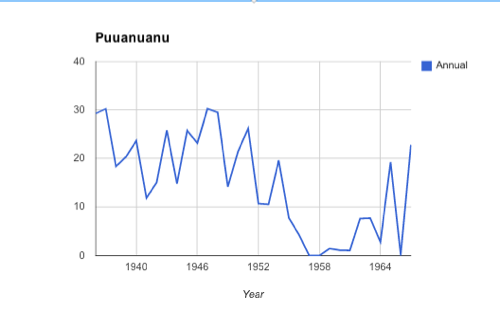
Today I analyzed rainfall data and made line graphs. I tried to graph a few that seemed "typical" and a few abnormal ones. Puuanuanu, for example, has three years with less than an inch of rainfall while Puuhue has years with over 100 inches. I'm only posting two graphs today because these are the only ones I have had time to double check the data (make sure I didn't make a typo in transferring). I'm going to try to find the geographical locations of each area to better understand the range of rainfall.
Comments