Today I continued to add more features to my mango interface, as we have already put op all of our existing data points.
One feature we wanted to have was the ability to click on buildings.
Right now, hovering brings up a window with the current values.
We wanted to be able to see all the data for the building by clicking on it.

One feature we wanted to have was the ability to click on buildings.
Right now, hovering brings up a window with the current values.
We wanted to be able to see all the data for the building by clicking on it.
Because you click on this HTML select element to update the graph, I had to find a way through JavaScript to simulate selecting an option.
I couldn't set the option as a default through HTML because the specific elements do not exist hard coded. All I code is the creation of the menu, it is populated by the Mango API, which only returns active sensors with the user permission. Thus, I had to find a way to select an item that does not exist at first.
I couldn't set the option as a default through HTML because the specific elements do not exist hard coded. All I code is the creation of the menu, it is populated by the Mango API, which only returns active sensors with the user permission. Thus, I had to find a way to select an item that does not exist at first.

Here is the function I wrote, which allows me to select the data point as an input parameter.

However, this would only change the selected value, it would not actually update the chart div.
After an hour of digging through, I found the code that updated the amcharts data provider with the mango data poitns form the HTML select menu was called inside a on('change') function, so I instead moved it out to a complelty new function called refreshChart.

I then call this function once every second.

Now that the amcharts updates with whatever is selected in the menu, I update the menu though an onclickcall on my SVGs, with the correct data point as the input parameter.

It works!
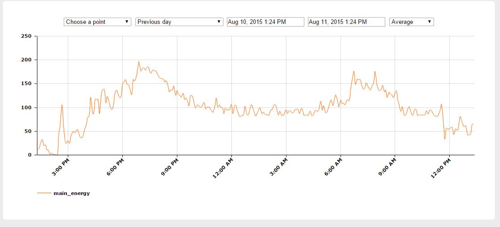
I can hover on a building to see the current values, and click on the building to see all its past data in the graphing utility.
I can hover on a building to see the current values, and click on the building to see all its past data in the graphing utility.
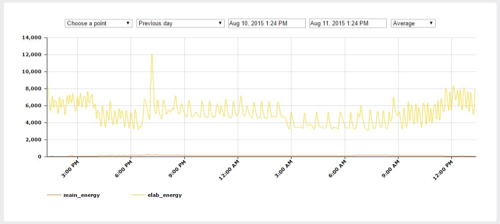
Another feature I wanted to add was the ability to load up the total campus energy consumption value as the default point value to graph.
I accomplished this by calling my function onload inside the body.

Now, when you first go to the interactive map interface, it automatically loads the total energy consumption by default!
Comments