Today I worked on fixing the javascript value storage issue.
After Steven and I dug through the API, we discovered that that the mangoRest.realtime.getCurrentValue function takes in another function as an input parameter, and crafts that into a ajax template promise internally.
This allows the server to capture the value and return it inside the function.
It also explains why my return did not work; I was not returning the value to my own function, I was returning it to the promise ajax template.

It also explains why my return did not work; I was not returning the value to my own function, I was returning it to the promise ajax template.
Because I could not return the value or set it to a global variable without changing how the API functions, I decided to utilize HTML as a proxy for temporarily storing the value.

However, this did not work.
After about an hour of debugging I found that this was because the mangoRest.realtime.getCurrentValue function does not immediately return a value.

In other words, I am trying to read a value that does not exist yet.
I then modified my code to only call my HTML retrieval function once my querry function returns a value.

However, this did not work either.
Because the promise is handled internally by the API, my own query function returns as done once it starts the request, not once the request returns a value.
Again, because changing this would require modifying the core Rest API, I decided to look for more alternatives.
Again, because changing this would require modifying the core Rest API, I decided to look for more alternatives.
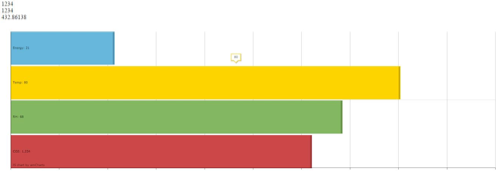
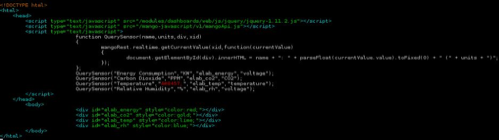
We decided to go back to the dashboard templater for the master graph, as that will utilize user input, and we will populate HTML divs with the QuerySensor function.
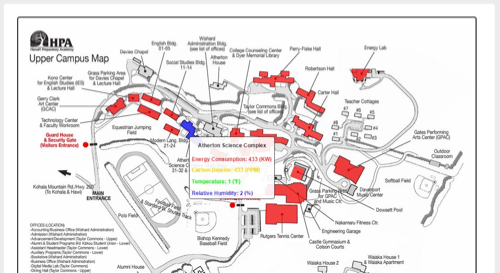
Here is the new, parsed, formatted ouput:
Rather than individual bar charts, each value is rendered from the XID as text.

Rather than individual bar charts, each value is rendered from the XID as text.
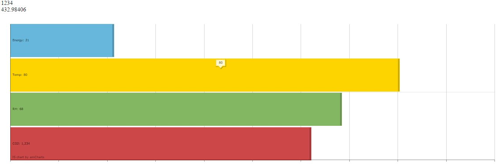
I then integrated it with my index page, so that each SVG would trigger a hover window that contains the above information.
Curiously, I had to change my index.htm to a .shtm file: http://10.14.4.52:8080/private-dashboards/index.shtm
I then called my querries at the top, and assigned it to the appropriate divs.

My divs are contained inside the update window that is triggered by the SVG.

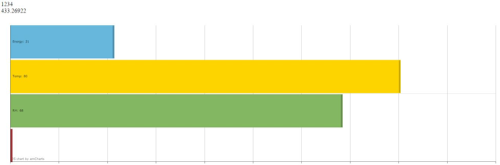
Here is the output:

I then expanded my code to create hover windows for all of the buildings.
Our next step is putting all of the sensors into mango, so that I can reference them by their unique XIDs, creating the master chart with the dashboard templater, and using the Netatmo API to allow us to integrate their data into our network.
Comments