Today we finally fixed the group select configuration issue!: http://10.14.4.52:8080/private-dashboards/test.shtm
We apparently had to switch our entire code from using the dashboard templater API to the Mango rest API.
This was because the dashboard templater is designed for user input, so it only calls a refresh() once a grouplist is clicked on.
Instead, we switched to the Rest API, which matches the XIDs to the point values on page load.
Once we learned this, we had to impliment the Rest code thorough a bar chart, and here is the resulting code:
Once we learned this, we had to impliment the Rest code thorough a bar chart, and here is the resulting code:
He start by creating pointconfigurations with unique datapointmatchconfigurations and XIDs. the datapointmatchconfigurations are shared by each graph, but the XIDs are completely unique (19x76)

We then add a barchartconfiguration with the correct div id and datapointmatchconfiguration.
We leave the category field as the name and the value field as the value.

Once that is done, we have to actually implement the Mango Rest API.
we start with the getALL function, which actually queries Mango and returns the data values for each XID.

There is also apparently a required showError function, as the code crashes without it.

Nevertheless, the end result is a graph identical to the one created using the dashboard templater, the only difference is that I do not need to click on the target folder inside the point hierarchy in order to make it load the data.
Next, we started configuring the amcharts to match the template we designed for the hover windows.
I copped over my code from the live editor into the bar chart constructor.

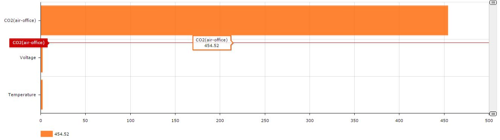
However, this was the result.
This was because the constructor only takes in the datapointmatchconfiguration id as input, and creates a graph for each data point, which is why there were 4 graphs for all 3 data points.
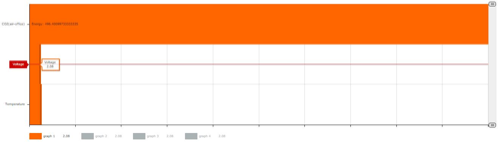
When I only have one graph code, here is the result:
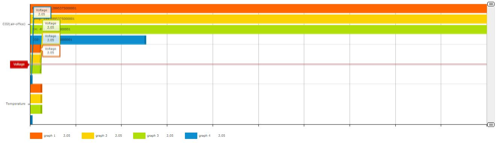
However, this is unusable, as the data needs to be shown on different scales, and given other colors, to distinguish them as unique data points.
In order to do this, I had to change the valuefield from "value" to a specific xid.

This did not work either. I then looked into the API and saw that the constructor follows the format of:
new BarChartConfiguration(‘divId’, [dataProviderIds], AmChartJSON, mangoChartMixins, options)
Thus, I decided to put in my own datapointmappigns.

This too caused the graph to not render.

I then spent time on the amcharts live editor to figure out how to fix the graph, and saw that the data structure is organized into
category == individual data point
column == individual graphs
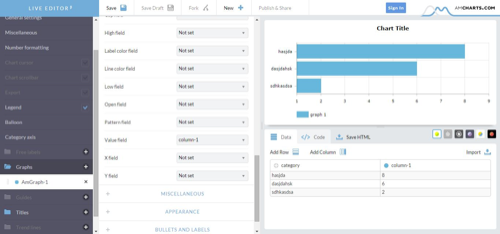
In other words, I have to find a way to map individual data points to the individual graphs, or individual columns to individual categories.
Comments