Today we successfully integrated the graphing utility and one of our own real data points into the telemetry map interface.
We started by building the graphing utility itself.
We had to figure out which libraries the code needed.
We had to figure out which libraries the code needed.

For some reason, we needed the @import url line, so that we would not have the weird years at the bottom.
Inside the JavaScript, we removed the unnecessary menus, and gave it a default value of 1000 query-able sensors.

We then create inputs for the user, and a div for the graph .

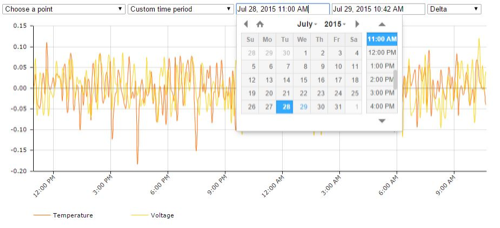
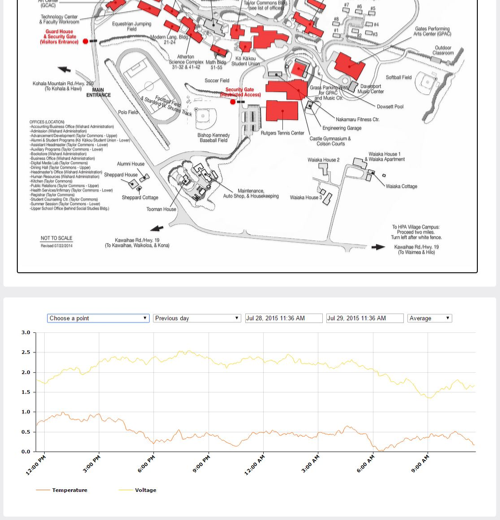
Here is the working output:
You simply select a sensor from the drop down menu, and amcharts does the rest.
You can also graph multiple data points and change the range.
You can also graph multiple data points and change the range.
We also tried to get it to auto load a data point.

However, it did not work.

I then migrated the graphing utility into the telemetry map.
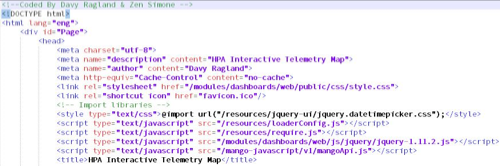
We started by importing the correct libraries.
We started by importing the correct libraries.
We then had to incorporate the code for creating the chart into the code for querying the sensors.
I decided to place the graph code inside a library import declaration.
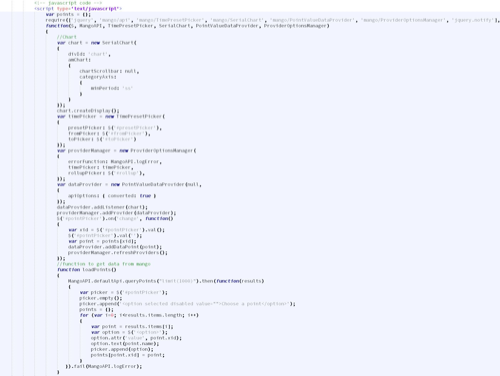
I then put my function for retrieving strings into the library declaration as well.
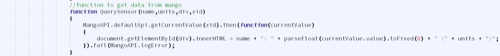
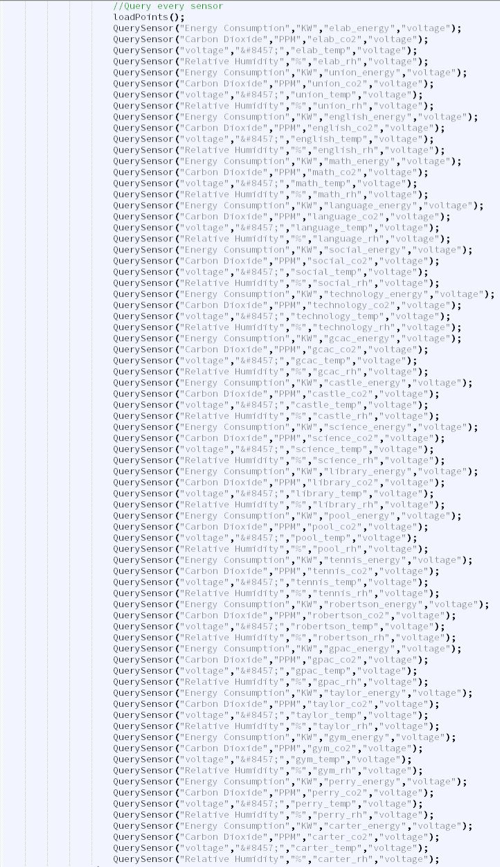
After that, I ran the function to initiate the graph, and to query all the sensors.
Finally, I close the library deceleration, and declare my hover functions.

The graphing utility works on our map page!
Once we accomplished that, we decided to add in a real data point, instead of the demo voltage one.
We started by understanding the relationship between the data source, the data name, and the data point.


Here is the hierarchy we have decided upon:
building_atmo
|___building_co2
|___building_temp
|___building_co2
|___building_temp
|___building_rh
building_xml
|___builiding_energy
Here is gym data source:
we gave it the same name and XID.
We also had to set the host, port, and delimiter.
we gave it the same name and XID.
We also had to set the host, port, and delimiter.

Then, we had to edit the point, to have the correct name, XID, read command, value regex, value index, unity, and logging interval.

It works!

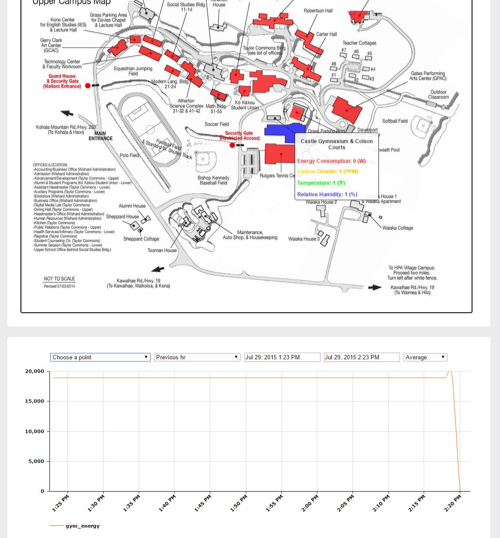
I then changed my JavaScript to call the QuerySensor with the new xid, and it returns a value to the hover window, and I can graph it using the utility at the bottom!
Comments