Week 31 Summary

This week I wrote the ISR Documentation Whitepaper, in which I detailed how I implemented my project and summarize the results of my work. The appendices provide the reader with the documentation and resources they need to use, recreate, or expand on my final product.
(Could not attach the .pdf file)

0 comments

Week 30 Summary

Due to the AP exams, I missed the first two ISR classes of this week. In the last class, I spent most of the time looking back on the data and tried to make sense of it. I run the original program with all the channels and the results seemed pretty accurate compared to what I got on the Google Sheet, so I decided not to make any changes. We also discussed the plan for the end of the year, and our last assignment would be a documentation whitepaper which will serve as the summative documentation of our independent projects. I will start working on it next week and finish the year strong.

0 comments

Week 29 Summary

This week I entered the raw data of more channels and tried to graph it in Google Sheet. I counted the frequencies by hand again to get an approximation, therefore calculating an estimated value for the threshold more precisely. Here is my work:

https://docs.google.com/spreadsheets/d/1H2Yp96BnYjRcZUBHKU0VLmbs-curmIRIUYfvjX9_YuY/edit#gid=633243042

It can be inferred that the frequencies are mostly in the range from 20 to 30Hz, but the differences for the threshold are pretty similar (~10) except for F7 in this set of data. My next step would be trying to adjust the program and run it with different sets of data, and from there I can calculate the measurement errors and see how much it would affect the accuracy.

0 comments

Week 28 Summary

This week everyone in our ISR class had to give the end-of-year presentation to Mr. Ferrell and Ms. Petteys (unfortunately, Mr. Ferrell was paying a visit to Washington, D.C. and could not make it to the meetings). On Monday, we as a whole rewatched the videos of mock presentations that we recorded last week and gave one another further feedbacks on our grows and glows. I had my own 15-minute presentation on Wednesday and I think it went pretty well. After that, I spent the rest of my time actively listening to others' talks in order to learn and support my peers. Here is a picture of me presenting:

0 comments

Week 27 Summary

This week we mostly focused on preparing for the end of year presentation that would occur next week. Each of us had to do an individual mock presentation and have it videotaped, then we as a whole class would watch and give feedbacks on one another according to the rubric. This practice was very helpful as I learned a lot about presentation skills through opinions from the audience. Here is the link to the Google Doc of my feedback: https://docs.google.com/document/d/1Pz5LcjS_bpdxvpHOny-msMdnofA0AdoRJ7v-WuTCDJY/edit?ts=5717d2ad.

ISR Presentation Information:
- Project title: EEG Evaluation of Stroop Effect
- Original goals: Study patterns of neural responses under the Stroop effect
- Essential question for the project: What is the relationship between conformity behaviors and Stroop effect? How does conformity vary in different types of learners?
- Ultimate accomplishments: Uncover the neurological origin of conformity in learning behaviors

0 comments

Week 26 Summary

This week I mainly continued working with the code. I simply added a function to count the maxima so it would save me from counting them by hand. To do so, I set a variable 'count' with initial value of 0 and each time the program detects a local maximum that satisfies the conditions, 'count' increases by 1. Here is what it looks like:


I also tried to run the program with different set of data. I picked the column F7 and extracted 128 bits from it. The result was pretty shocking: there were only 3 maxima. Then I decided to enter the data on Google Sheet and graph it:


According to the graph, there are not many significant peaks. The difference between the maxima and their adjacent values does not seem so sharp either, and I guess not up to 10 as I set in the conditions. This poses another question for me: What is a good approximation for the threshold? I think my next step would be analyze a complete set of data and calculate it using mathematical and statistical methods.

0 comments

Week 25 Summary

This week I finally finished the coding for the program that could help me count the brain waves frequency. The only thing different from the original code was that I used a "for" loop to iterate the list and set conditions "if" to point out the maxima. When I counted it raw by hands, I got 23Hz; when I ran this program, I got 28Hz, which was not very off. For now, I decide to go with this program because this is so far the best way I could find to minimize the errors. Here is a complete look of the code:

import csv
import numpy as np
from scipy.signal import argrelextrema
import matplotlib.pyplot as plt

twoDimArray = []

def getColumn(x):
column = []
for row in twoDimArray[1:]:
column.append(float(row[x]))
return column

with open('target.csv') as csvfile:
reader = csv.reader(csvfile, delimiter=',')
for row in reader:
twoDimArray.append(row)

columns = {}
n = 0
for cell in twoDimArray[0]:
columns.update({cell:n})
n = n + 1

rows = {}
n = 0
for row in twoDimArray:
rows.update({row[0]:n})
n = n + 1
column0 = getColumn(0)
column1 = getColumn(1)

x = np.array(column0)
y = np.array(column1)

sortId = np.argsort(x)
x = x[sortId]
y = y[sortId]

for i in range(1, len(y)-1):
if (y[i]-y[i-1] >= 10) or (y[i]-y[i+1] >= 10):
print x[i]
print y[i]

And here is what the console looks like:

0 comments

Week 24 Summary

This week I spent most of the time reviewing my program because according to the last time I ran the codes, it had way too many extrema in 128 bits (~1 second), which is impossible to be the brain waves frequency. Therefore, I decided to graph one channel only and count the peaks by hand to estimate the frequency. Here is what I got:


From this graph, I then estimated the frequency by counting the peaks by hand like the way I did before. Additionally, I compared each peak, which was actually a local maximum in the list, with the 2 closest values and get the average difference interval in order to set the threshold. According to my counting, the frequency was around 23Hz and the average difference calculated was +- 10:


My next step would be to assess some more data to get a more accurate estimation. As soon as I have a solid number, I will get down to adjusting the coding part.

0 comments

Week 23 Summary

This week I started to put in real data to see how the program processes it. I tried to run a small sample of 128 bits only (equivalent to 1 second of recording). And here was what I got:


As displayed in the screenshot above, there were about 50 maxima/minima according to the functions in argrelextrema library. This is impossible because EEG frequency band usually falls within 10-30 Hz. I was also working on counting these by hands to get an approximate value for the frequency. Needless to say, I will have to modify the codes, maybe by setting the limits for the maximum/minimum intervals, in order to get the right results. I hope this will not take too much work and time so that I can wrap it up before spring break.

0 comments

Week 22 Summary

This week I wrote a piece of code textreader.py that reads in text and changes the (format) of the original .csv file. I found out the file that does not work, which ends in \r instead of \n, cannot distinguish the new lines. So I created a variable 'final' to replace \r with \n and opened it with target.csv. I inserted this code at the beginning of csvreader.py and it finally worked!

from sys import argv

script, filename = argv

txt = open(filename)

print "Here's your file %r:" % filename
initial = txt.readlines()[0]
print initial

final = initial.replace("\r", "\n")
print final

target = open("target.csv", 'w')
target.write(final)


My next step would be trying to analyze one complete data set and see how it goes. I will probably need to add some more supports but so far I have got the core coding. Now with the help from this program, I look forward to a next quarter with better testing and understanding the statistical significance of the data.

0 comments

Week 21 Summary

This week I continued working on the software development. I spent most of the time figuring out the error "new-line character seen in unquoted field - do you need to open the file in universal-newline mode?" when I tried to run the original eegsample.csv file with csvreader.py. I looked it up on StackOverflow and here was what I got:

http://stackoverflow.com/questions/17315635/csv-new-line-character-seen-in-unquoted-field-error
http://stackoverflow.com/questions/17770727/new-line-character-seen-in-unquoted-field
http://stackoverflow.com/questions/26102302/python-csv-read-error

I had tried a couple of ways but unfortunately none of them worked. I also tried to make up a new list by copying part of the data by hand and saving it as a .csv file, however the reader still failed:


Mr. H suggested me to write a code that reads in text first, and then we can incorporate the .csv reader later. I will dedicate my time in the next few classes to working on this problem with him, and hopefully we will get it done by the end of next week.

0 comments

Week 20 Summary

This week I had major achievement in coding. With Mr. H's guide, I finally succeeded in writing a piece of code to find the relative max/min in a 2D array list:

import csv
import numpy as np
from scipy.signal import argrelextrema
import matplotlib.pyplot as plt

twoDimArray = []

def getColumn(x):
column = []
for row in twoDimArray[1:]:
column.append(float(row[x]))
return column

with open('sampletiny.csv') as csvfile:
reader = csv.reader(csvfile, delimiter=',')
for row in reader:
twoDimArray.append(row)

columns = {}
n = 0
for cell in twoDimArray[0]:
columns.update({cell:n})
n = n + 1

rows = {}
n = 0
for row in twoDimArray:
rows.update({row[0]:n})
n = n + 1
column0 = getColumn(0)
column1 = getColumn(1)

x = np.array(column0)
y = np.array(column1)

sortId = np.argsort(x)
x = x[sortId]
y = y[sortId]

#plt.plot(x-1, y)
#splt.show()
maxm = argrelextrema(y, np.greater)
minm = argrelextrema(y, np.less)
print maxm
print minm

And when I tried to run it, this is what I got without plotting:


The next step for me would be to import the huge data in csv. collected from the headset. There must have been some errors with the formatting that I could not run it with python. As long as I figure this out, I will reach my goal of software development and speed up my project progress.

0 comments

Week 19 Summary

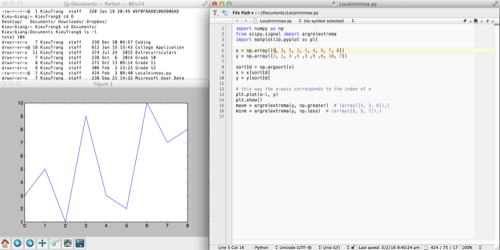
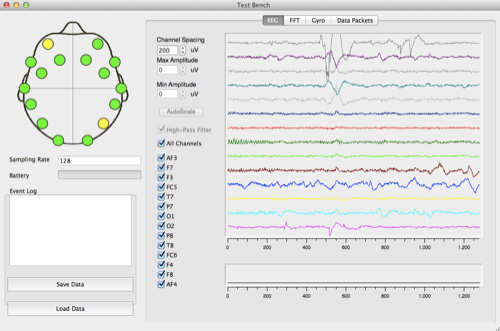
This week I made a lot of progress on the software development. I found a piece of Python code on StacksOverflow that help me find relative extremum:

import numpy as np
from scipy.signal import argrelextrema
import matplotlib.pyplot as plt

x = np.array([6, 3, 5, 2, 1, 4, 9, 7, 8])
y = np.array([2, 1, 3, 5, 3, 9, 8, 10, 7])

sortId = np.argsort(x)
x = x[sortId]
y = y[sortId]

# this way the x-axis corresponds to the index of x
plt.plot(x-1, y)
plt.show()
maxm = argrelextrema(y, np.greater) # (array([1, 3, 6]),)
minm = argrelextrema(y, np.less) # (array([2, 5, 7]),)

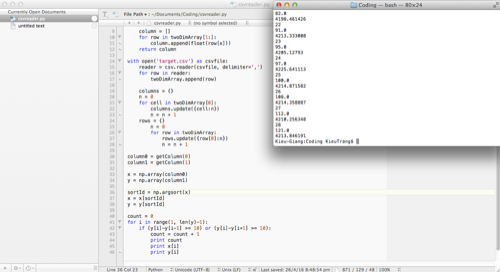
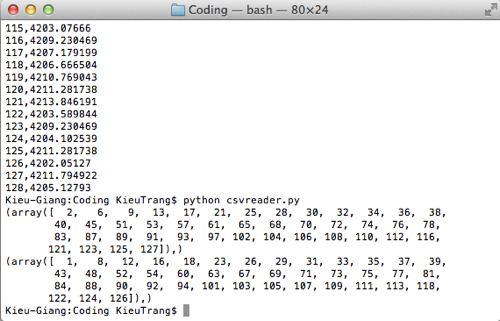
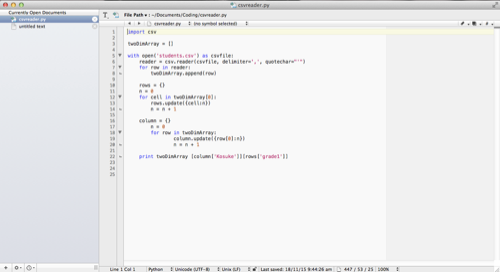
Here is the console when I try to run this code:


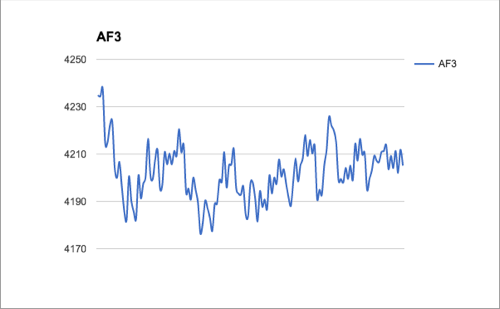
I already have my raw data demonstrated in lists and the code base to find the relative minimum/maximum, and now my task is to combine these two separate results together. I plan to continue working on this next week by developing and understanding the code as well as applying it to the real data.

0 comments

Week 18 Summary

This week on Monday I had a presentation with Mr. Ferrell and Ms. Petteys. I briefly introduced my project to them again and discussed about my achievements as well as challenges in the last semester. The presentation went well, and they did not have many questions for me. Here is the link to my white paper: https://docs.google.com/document/d/1ZfrXAhKwaNotlFm7Qm994LeQ3fYh0JXeFcjaCi-zFOY/edit. I also included a research overview that I made during winter break as an appendix. It thoroughly described my project from introduction, methodology, to analysis.
Download file "Kieu-Giang NGUYEN Research Overview.pdf"
I missed one class on Wednesday due to my independent Spanish presentation. On Thursday, I had a short individual meeting with Mr. H. We made some comments on my presentation skills and how to improve it for the big one in May. We also talked about the plans for the next few classes. Hope everything is in progress!

0 comments

Week 17 Summary

This week was pretty productive for me even though we had only 2 periods of ISR. On Tuesday, I decided to come back to testing after a while. I first tried on Kana'i head but it did not work (I guess it was because he had too much hair). After around 15 minutes without getting any signals from Kana'i, I switched to test on myself instead. I would not really trust my data since I already knew the Stroop test like the back of my hand, however, it was more like a chance for me to practice observing and analyzing EEG data:


I also successfully downloaded TextWrangler — a powerful, general-purpose text editor that provides a clean, intelligent interface to a rich set of features for editing, searching, and manipulation of text with high performance — to build a program in Python for my software development. I planned to start with the simple codes, and go into details later, beginning next week.


On Thursday, I spent my time making a white paper for my presentation coming up next week. Here is the link to my google doc: https://docs.google.com/document/d/1ZfrXAhKwaNotlFm7Qm994LeQ3fYh0JXeFcjaCi-zFOY/edit

0 comments

Week 16 Summary

This week I basically planned out my project in the second semester and started working with the raw data. Also there are some changes in weblog updates, and from now on we only have to write one detailed weekly summary. I hope to achieve all the goals that I proposed in the Gnatt chart and finish strong this year.

0 comments

01.13.2016

Today I look at the data collected in .csv file again and think about where I should start. Because the values demonstrated in each column correspond to the voltages of each sensor, my task is actually to find the relative maxima/minimum of those values in certain intervals as they are the peaks of the waves, and then counting how many maxima/minima there are in order to get the frequency values. It hence poses some questions:
1. What is the reasonable interval to consider all the significant relative maxima/minima?
2. What is the minimum difference between values to make it a significant relative maxima/minima, as when the data is displayed in graph, should we count the very small peaks?

I try to look up some Python codes that have function of finding relative maxima/minima. I think StackOverflow has some good ones but I still have to remodel them to fit with what I look for:
http://stackoverflow.com/questions/4624970/finding-local-maxima-minima-with-numpy-in-a-1d-numpy-array
http://stackoverflow.com/questions/18898694/python-how-to-get-local-maxima-values-from-1d-array-or-list
http://stackoverflow.com/questions/21321274/how-do-i-find-the-relative-maximum-in-a-function

0 comments

01.11.2016

Happy New Year! I am so excited about this independent project in my last semester at HPA. So in the first ISR class of the year, I decide to draw a detailed plan for my "EEG Evaluation of Stroop Effect" project and make some changes in the Gantt chart. Here is the link to view it: https://docs.google.com/spreadsheets/d/1Bw6SH7E4GoCYM2uwCcuAt5dlVkhjpaC48uczlKae3D4/edit#gid=0. Basically, I divide the project into 3 subtasks: experiments, data analysis, and software development. I will do all of these three work simultaneously instead of focusing on only one at a time. Over the break, I also found out some interesting statistical results about the data collected from last year, and I look forward to sharing this with teachers and students at the mid-year presentation.

0 comments

12.04.2015

0 comments

12.03.2015

Today we basically talk about the plan for the next 3 classes left of the semester. We have to make a quarter video about the achievements and goals of our projects. We also have some interesting intellectual discussions and introduce the energy lab to a tour visiting HPA.

0 comments