Module 18-abundance and distribution
Start with this:
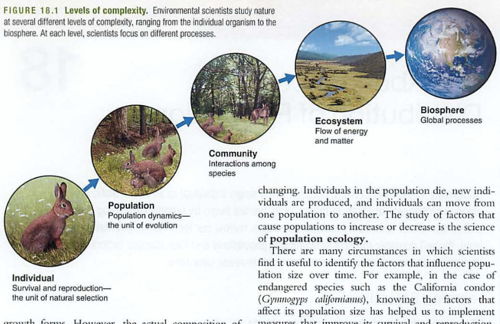
We covered ecosystem energy and matter a few weeks ago, this chapter is about population ecology.
Notation: Pop size is represented as N (note not "n"): population size within a defined area at a specific time (brings in migration).
Check out the diagrams on pop distribution: random, uniform and clumped. Important vis a vis biodiversity
Structures: age and gender (sex)
Density dependent factor: e.g. food or reproductive rate in rats (more rats, lower fecundity)
Something that influences reproduction or survival...
Density IN-dependent factors: storms, disasters, fires (note density independent: one bambi or 100 bambi all perish in the same fire)
Limiting resource: usually food, but could include space, nutrients, etc.
Carrying capacity: K (note not "k"): how many individuals an environment can support
Module 19: growth models
Check this out:

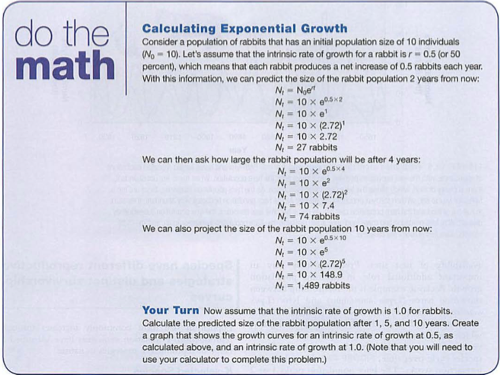
This is called exponential growth, or "J shaped growth"
Note that it has no end, or limiting factor.
Small r is the growth rate. If you have had physics (yay!) this is usually "k" in some examples, or related to RC.
Learning this equation is VERY useful.
Note that it depends on two things: the amount in the population (No) and the growth rate (r)
Here is an example:
Many systems follow J shaped exponential growth until they run out of food or space, then there is overshoot and die-off. A more ideal version of this is the S shaped curve, called logistic growth:

Here is a formula for logistic growth that we'll discuss:
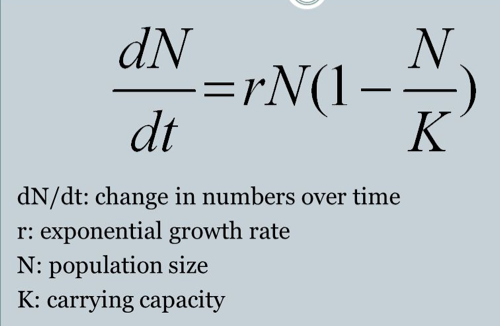
dN/dt is just the rate of population growth (some of you may see this as the slope of the S curve)
Note that when the ratio N/K is very small, the parentheses become 1, so the formula is rate = rN
As N/K nears one (number of critters equals carrying capacity) the term in the parentheses becomes zero, so no growth.
Note also that if N/K is GREATER than one, the growth rate (slope of the curve) become negative. This is overshoot and die off.
Ok, now check this out:
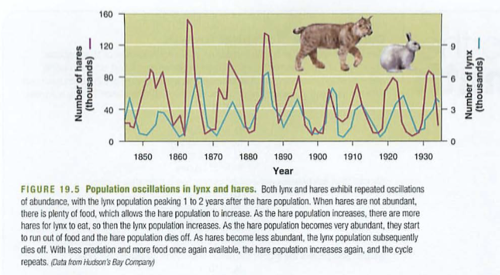
Note the phase (timing) relationship between the abundance of the food and the population of the prey, then the predator.
Now we can discuss generalizations of r and K strategists:
Now we can discuss generalizations of r and K strategists:

Where do you fit in? How about Nemo?

There is a fourth: deer. How would you imagine this curve?
/groups/apenvironmentalscience/search/index.rss?tag=hotlist/groups/apenvironmentalscience/search/?tag=hotWhat’s HotHotListHot!?tag=hot6/groups/apenvironmentalscience/sidebar/HotListadminadmin2020-08-19 15:43:59+00:002020-08-19 15:43:59updated30adminadmin2011-09-08 21:36:21+00:002011-09-08 21:36:21updated29adminadmin2011-08-24 23:20:40+00:002011-08-24 23:20:40updated28adminadmin2011-08-24 22:42:36+00:002011-08-24 22:42:36updated27adminadmin2011-08-22 02:41:09+00:002011-08-22 02:41:09updated26adminadmin2011-08-22 02:40:02+00:002011-08-22 02:40:02updated25adminadmin2011-08-21 20:39:11+00:002011-08-21 20:39:11updated24adminadmin2011-08-21 20:30:42+00:002011-08-21 20:30:42updated23adminadmin2011-08-21 20:30:13+00:002011-08-21 20:30:13updated22adminadmin2011-08-21 20:25:48+00:002011-08-21 20:25:48updated21adminadmin2011-08-21 20:25:18+00:002011-08-21 20:25:18updated20adminadmin2011-08-21 00:22:12+00:002011-08-21 00:22:12updated19adminadmin2011-08-21 00:18:56+00:002011-08-21 00:18:56updated18adminadmin2011-08-21 00:15:43+00:002011-08-21 00:15:43updated17adminadmin2011-08-21 00:12:37+00:002011-08-21 00:12:37updated16adminadmin2011-08-21 00:12:02+00:002011-08-21 00:12:02updated15adminadmin2011-08-20 23:59:41+00:002011-08-20 23:59:41updated14Added tag - hotadminadmin2011-08-20 23:59:38+00:002011-08-20 23:59:38addTag13Added tag - conservationadminadmin2011-08-20 23:59:32+00:002011-08-20 23:59:32addTag12Added tag - critical thinkingadminadmin2011-08-20 23:59:19+00:002011-08-20 23:59:19addTag11Added tag - ch1adminadmin2011-08-20 23:59:08+00:002011-08-20 23:59:08addTag10Added tag - sustainabilityadminadmin2011-08-20 23:59:05+00:002011-08-20 23:59:05addTag9adminadmin2011-08-20 20:47:39+00:002011-08-20 20:47:39updated8adminadmin2011-08-20 20:46:15+00:002011-08-20 20:46:15updated7adminadmin2011-08-20 20:43:07+00:002011-08-20 20:43:07updated6adminadmin2011-08-20 19:14:13+00:002011-08-20 19:14:13updated5adminadmin2011-08-20 19:11:26+00:002011-08-20 19:11:26updated4adminadmin2011-08-20 18:59:57+00:002011-08-20 18:59:57updated3adminadmin2011-08-20 18:56:59+00:002011-08-20 18:56:59updated2First createdadminadmin2010-11-07 01:41:28+00:002010-11-07 01:41:28created1wiki2020-08-19T15:43:59+00:00groups/apenvironmentalscience/wiki/welcomeFalseCh01 Overview/groups/apenvironmentalscience/wiki/welcome/Ch01_Overview.htmladmin30 updatesCh01 Overview
Welcome to our APES wiki. You should be able to do the following after logging in with your account:
To create a new page, click the ...Falseadmin2020-08-19T15:43:59+00:00adminadmin2013-02-05 02:24:03+00:002013-02-05 02:24:03updated4Added tag - hotadminadmin2013-02-05 02:24:02+00:002013-02-05 02:24:02addTag3adminadmin2013-02-05 02:05:35+00:002013-02-05 02:05:35updated2First createdadminadmin2013-02-05 02:03:35+00:002013-02-05 02:03:35created1wiki2013-02-05T02:24:03+00:00groups/apenvironmentalscience/wiki/394a8FalseEnergy notes/groups/apenvironmentalscience/wiki/394a8/Energy_notes.htmladmin4 updatesEnergy notes
Week of 2.4.13: energy wrap-up
e2 video: coal vs. nuclear in class
AP exams: FRQ
2002.1
2004.2
2006.1
2007.2
2008.1
...Falseadmin2013-02-05T02:24:03+00:00adminadmin2013-02-05 02:23:20+00:002013-02-05 02:23:20updated6Added tag - hotadminadmin2013-02-05 02:23:18+00:002013-02-05 02:23:18addTag5adminadmin2013-02-05 02:23:12+00:002013-02-05 02:23:12updated4adminadmin2013-02-05 02:21:48+00:002013-02-05 02:21:48updated3adminadmin2013-02-05 02:20:26+00:002013-02-05 02:20:26updated2First createdadminadmin2013-02-05 02:06:00+00:002013-02-05 02:06:00created1wiki2013-02-05T02:23:20+00:00groups/apenvironmentalscience/wiki/c360bFalseFeb-May plan/groups/apenvironmentalscience/wiki/c360b/FebMay_plan.htmladmin6 updatesFeb-May plan
1. conclusion of energy chapters (see previous wiki)
2. GCC AP questions FRQ:
2006.2
2005.3
2005.4
2007.3
...Falseadmin2013-02-05T02:23:20+00:00adminadmin2012-03-07 05:53:55+00:002012-03-07 05:53:55updated14adminadmin2012-03-07 05:43:38+00:002012-03-07 05:43:38updated13adminadmin2012-03-07 05:41:35+00:002012-03-07 05:41:35updated12adminadmin2012-03-07 05:38:57+00:002012-03-07 05:38:57updated11Added tag - hotadminadmin2012-03-07 05:38:55+00:002012-03-07 05:38:55addTag10adminadmin2012-03-07 05:36:47+00:002012-03-07 05:36:47updated9adminadmin2012-03-07 05:22:26+00:002012-03-07 05:22:26updated8adminadmin2012-03-07 05:20:01+00:002012-03-07 05:20:01updated7adminadmin2012-03-07 05:18:58+00:002012-03-07 05:18:58updated6adminadmin2012-03-07 04:58:55+00:002012-03-07 04:58:55updated5adminadmin2012-03-07 04:57:33+00:002012-03-07 04:57:33updated4adminadmin2012-03-07 04:56:53+00:002012-03-07 04:56:53updated3adminadmin2012-03-07 04:54:20+00:002012-03-07 04:54:20updated2First createdadminadmin2012-03-07 04:53:33+00:002012-03-07 04:53:33created1weblog2012-03-07T05:53:55+00:00groups/apenvironmentalscience/weblog/de030FalseGreen Apple/groups/apenvironmentalscience/weblog/de030/Green_Apple.htmladmin14 updatesGreen Apple
Team,
Please watch this video about NYC:
Trailer:
http://www.pbs.org/e2/episodes/101_the_green_apple_trailer.html
On the server:
http://physics.hpa...Falseadmin2012-03-07T05:53:55+00:00adminadmin2011-09-13 19:08:24+00:002011-09-13 19:08:24updated4Added tag - hotadminadmin2011-09-13 19:08:22+00:002011-09-13 19:08:22addTag3adminadmin2011-09-13 19:08:10+00:002011-09-13 19:08:10updated2First createdadminadmin2011-09-13 19:04:30+00:002011-09-13 19:04:30created1weblog2011-09-13T19:08:24+00:00groups/apenvironmentalscience/weblog/4ecddFalseQuestions for Wednesday, wiki adds/groups/apenvironmentalscience/weblog/4ecdd/Questions_for_Wednesday_wiki_adds.htmladmin4 updatesQuestions for Wednesday, wiki adds
Team,
I'd like to try something for class tomorrow: each of you to create a question from chapter 3, and email it to me by this evening (Tuesday). Pl...Falseadmin2011-09-13T19:08:24+00:00hot/groups/apenvironmentalscience/search/index.rss?sort=modifiedDate&kind=all&sortDirection=reverse&excludePages=wiki/welcomelist/groups/apenvironmentalscience/search/?sort=modifiedDate&kind=all&sortDirection=reverse&excludePages=wiki/welcomeRecent ChangesRecentChangesListUpdates?sort=modifiedDate&kind=all&sortDirection=reverse&excludePages=wiki/welcome0/groups/apenvironmentalscience/sidebar/RecentChangesListmodifiedDateallRecent ChangesRecentChangesListUpdateswiki/welcomeNo recent changes.reverse5searchlist/groups/apenvironmentalscience/calendar/Upcoming EventsUpcomingEventsListEvents1Getting events…
Comments