


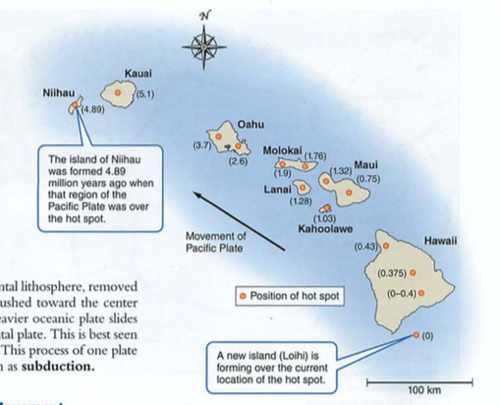
Hot spots:
Usually in the middle of an oceanic plate, but can also be mid-continent (e.g. Yellowstone supervolcano caldera)
Hot spots-basalt-low silica content which melts easier (e.g. look out the window)
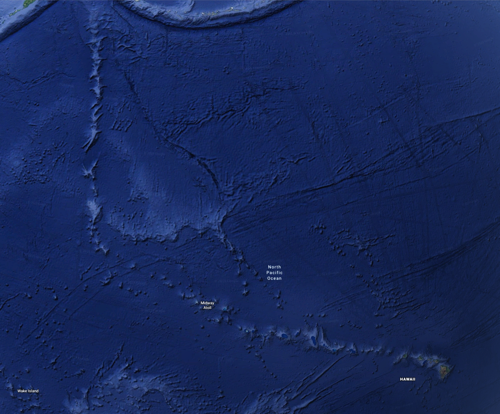
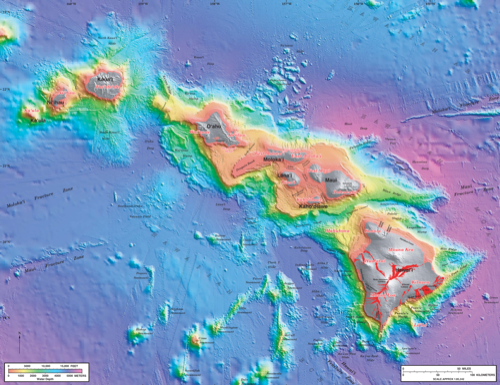
Look at the Hawaii island chain on google earth (underwater version)
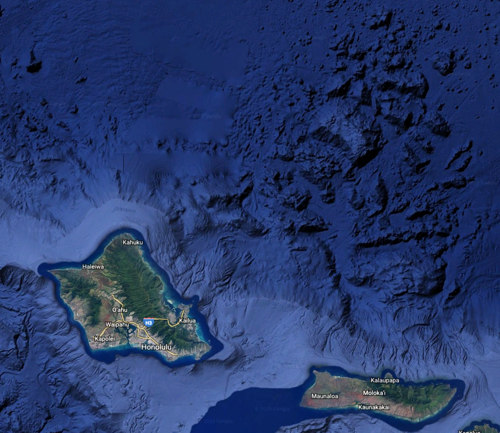
While you are at it, look for the Nuuanu landslide that created a 4000' tsunami
You can also look at the Mauna Loa simulated tsunami on youtube...
 |
| Click for a full-size image |
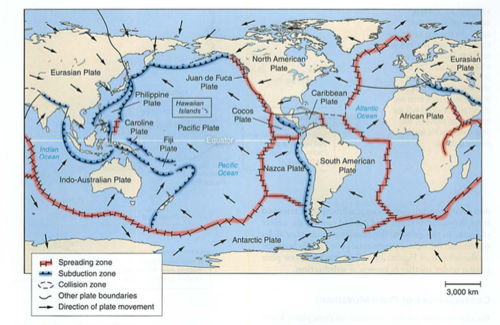
Note the tracking of the pacific plate:
 |
| Click for full-size image |
This is what happens to a shield volcano when it "calves" one side, in this case, the northeast side, in the Nuuanu landslide, one of the largest landslides on earth, causing a tsunami that deposited coral on the top of Mt. Kaala, 4055 ft. high...
 |
| Click for full-size image |
 |
| Click for full-size image |
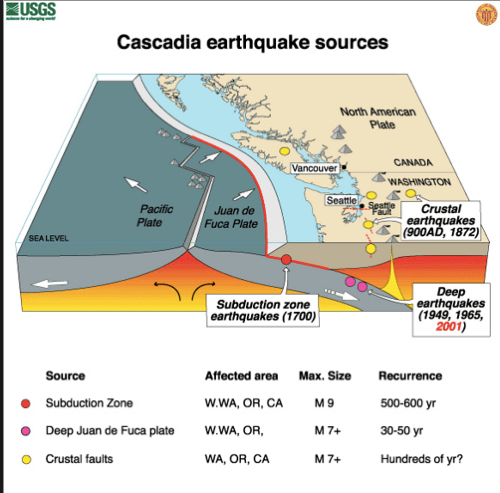
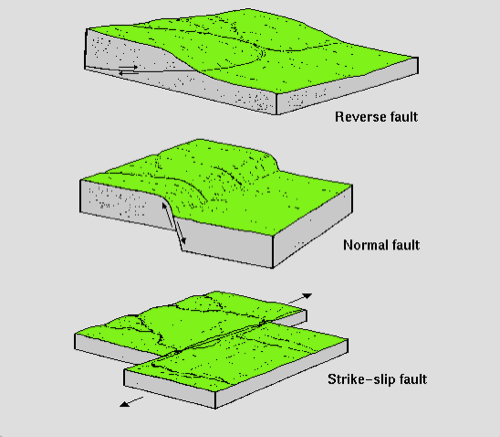
More about earthquakes:
 |
| Click for full-size image |
then there's the famous "not-my" fault...

The epicenter is the place ON THE SURFACE above the hypocenter (true origin) or earthquake FOCUS. Deeper hypocentric quakes often feel "longer", while shallow hypocentric quakes feel "sharp".

How do we find these?
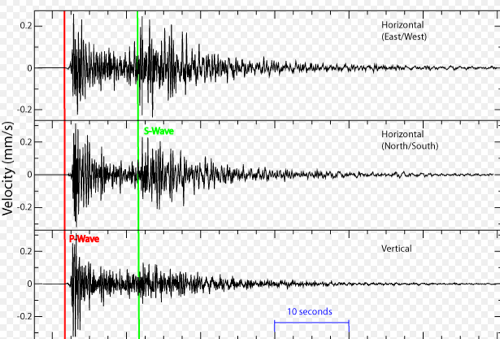
Seismographs:
P waves travel by compression (comPression). These are longitudinal waves, like sound. They can travel through liquid or solid.
S waves travel by shear (Shear). These are transverse waves, like a slinky. They can only travel through solids.
Remember this?

Ok, back to earthquakes.
Suppose you have a house on posts (called "post and pier" construction). An earthquake happens some distance away. First, your house moves back and forth (P wave, much faster at 8 km/sec). After a time, your house bounces up and down from the S waves (slower at 3 km/second).
If you are far away, these are separated by different arrival times.
If you are near the epicenter, they hit at the same time...up, over, down=your house is demolished
We use this difference to calculate distance from the epicenter (and hypocenter if you are interested) using delay times on the seismograph
 |
| Click for full-size image |
Look at the HPA seismograph here:
and our Hawaii quakes here:
Click on some earthquakes and note the depth and the seismic image.
Next: Rocks Module 25
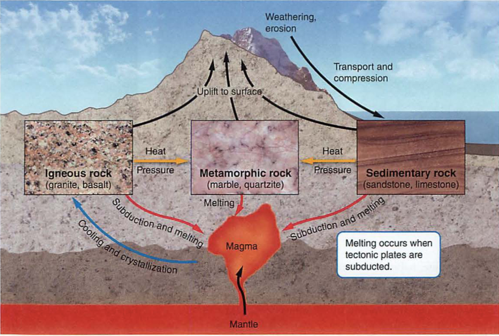
Igneous (fire)
Sedimentary (layers)
Metamorphic (Kafka rocks, just kidding: changed by heat and pressure)
 |
| Click for full-size image |
Igneous= directly from magma, and can be either basalt (low melting point, like our island or oceanic plates) or granite (lighter, what continents are made of)
Granite breaks down into light-colored sand, makes for fertile soil. Basalt (like us) can make sand too, but less fertile (e.g. black sand beach).
Sedimentary= just like it sounds, from mud, sand, or dust, usually in layers.
Metamorphic= changed by heat and/or pressure (slate, marble, or coal)
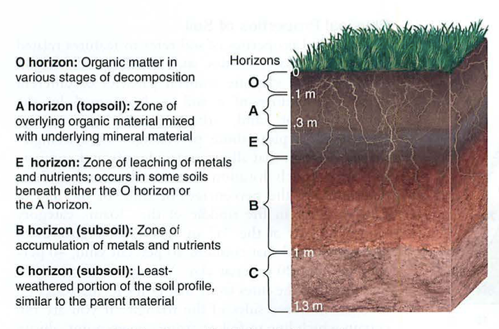
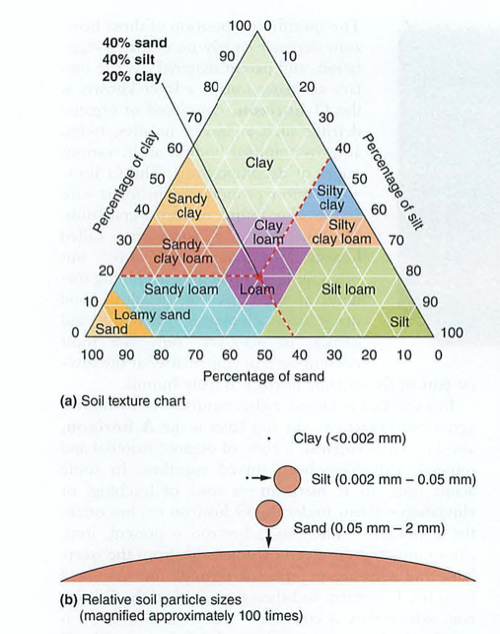
Soil-formed by weathering (chemical or physical) of parent rock
Erosion can be by water or air (wind)
Soil Horizons:
 |
| Click for full-size image |
 |
| Click for full-size image |
Our Soil Sieve has 4 filters, with 5 layers:
mesh 5 = 4 mm
mesh 10 = 2 mm
mesh 60 = .25 mm
mesh 230 = 0.063 mm
Basically, most of what you find is silt and clay...


Comments